Analyze your product recommendation strategy performance
Once your product collections are live on your website, you can track their impact through the reporting dashboard. This reporting page provides a set of KPIs that help you evaluate both engagement and business outcomes.
Access the results
From the Product collections list, locate the collection you want to analyze.
Click the Statistics icon (chart symbol).
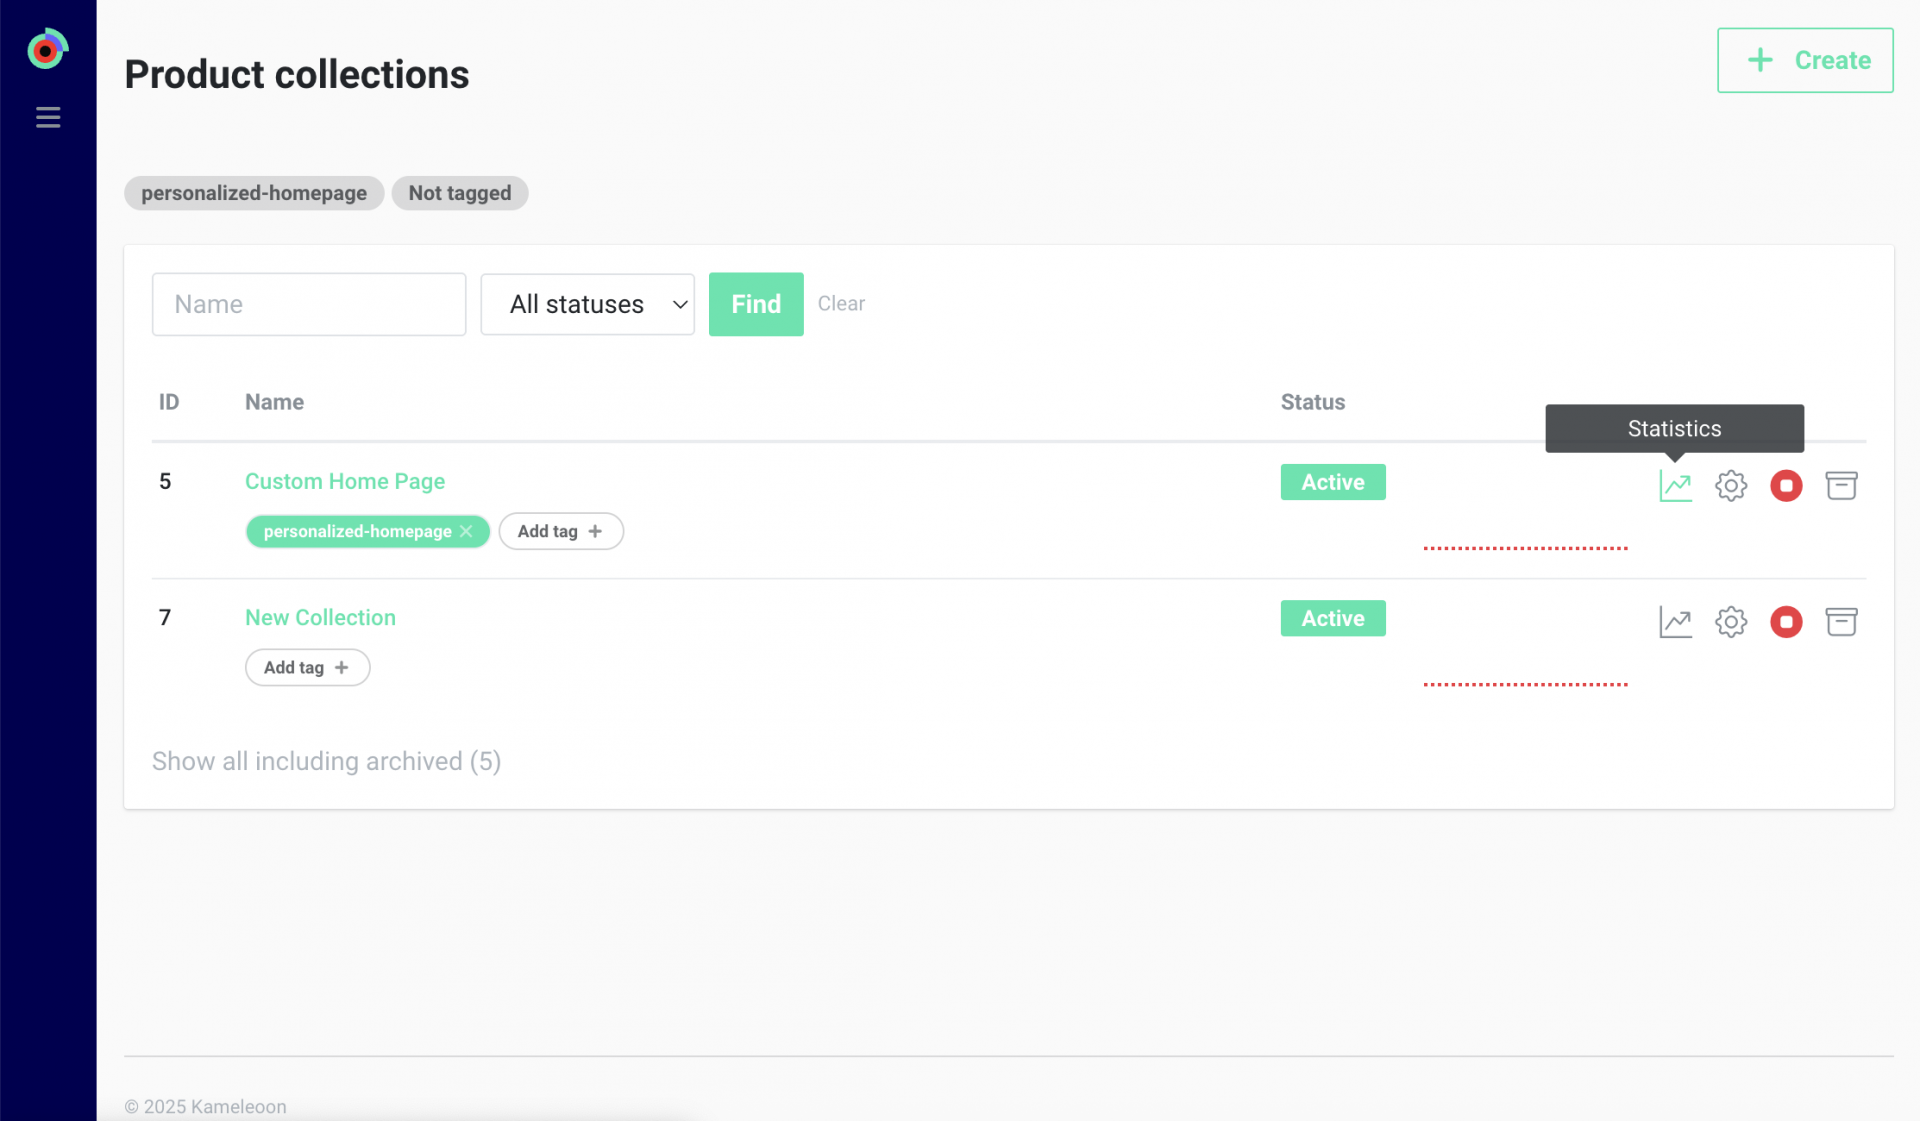
The Overview dashboard for the selected collection opens.
Read the results
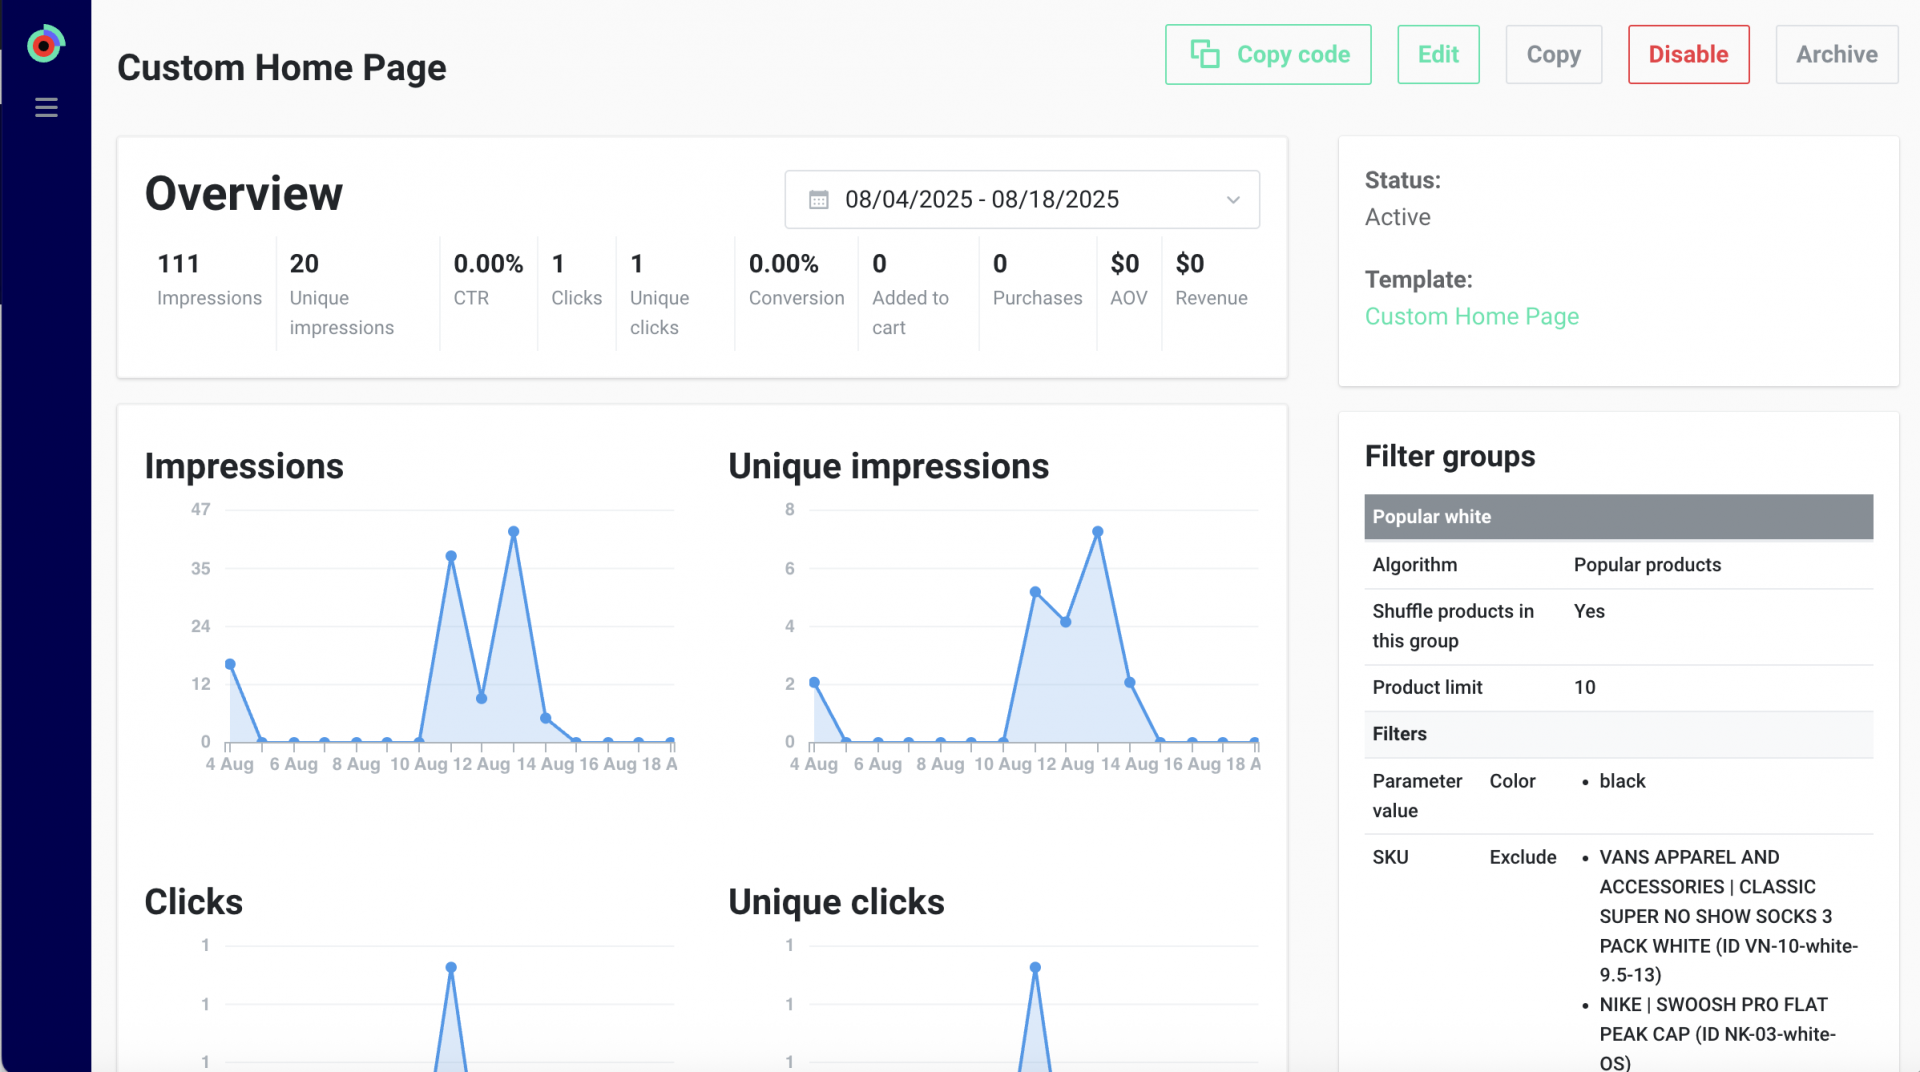
The Overview page displays:
- Top summary metrics (impressions, clicks, conversions, revenue)
- Charts showing performance trends over time (impressions, unique impressions, clicks, unique clicks, CTR, conversion).
- Filter groups panel on the right, listing the algorithms and filters used to build the collection.
Here is the available data:
| Name | Description |
|---|---|
| Impressions | Total number of times the collection was displayed on your site. |
| Unique impressions | Number of distinct visitors who saw the collection at least once. |
| CTR | Ratio of unique impressions to unique clicks. |
| Clicks | Total number of clicks on products within the collection. |
| Unique clicks | Number of distinct visitors who clicked at least one product. |
| Added to cart | Number of products from the collection that were added to shopping carts. |
| Conversion | Percentage of unique clicks that led to a purchase. |
| Purchases | Number of transactions resulting from clicks on the collection. If a product is purchased multiple times in one order, it counts as one purchase. |
| Average order value | Average transaction value generated via the collection. Calculated as Revenue ÷ Purchases. |
| Revenue | Total sales revenue generated by products clicked in the collection. |