Analyze your product recommendation strategy's performance
This is a premium feature. Contact your Customer Success Manager to enable it on your Kameleoon account.
Recommendation dashboard
Click Analytics > Dashboard in the product recommendation interface.

Here you'll find your recommendation blocks' performance over time. The attribution window is seven days. If users click a recommended item and purchase it within seven days, the purchase value is included in the revenue.
The dashboard consists of a bar chart and a table.

The chart displays your block' performance. The period analyzed is 14 days by default, but you can change this frequency in the top right of the dashboard.
Hover your mouse over the bars of the chart to access detailed data for each block.

Each column displays data for each block.
Recommendation block performance
On your Recommender blocks dashboard, click a block's name to analyze its performance.

The first open tab is Performance.
The period analyzed is 14 days by default, but you can change this frequency in the top right of the dashboard.

The page is divided between graphs and an Overview section.
Overview
Here is the available data:
| Name | Description |
|---|---|
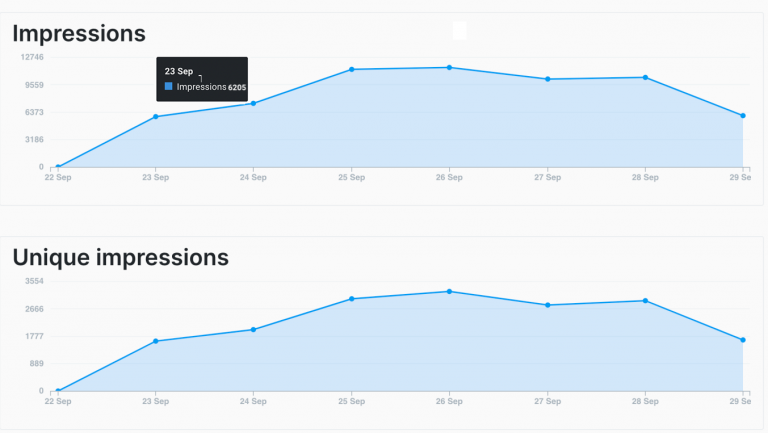
| Impressions | Total number of block impressions (a visitor can see the block more than once). |
| Unique impressions | Unique impressions are equal to the number of unique visitors. |
| CTR | Percentage conversion rate from "Unique impressions" to "Unique clicks". |
| Clicks | Total number of clicks on products in the block. |
| Unique clicks | Unique clicks are equal to the number of unique visitors. |
| Added to cart | Total number of recommended products added to cart. |
| Conversion | Percentage conversion rate from “Unique clicks” to “Purchases”. |
| Purchases | The number of transactions made after navigating from the recommendation block to a product page. If a product is purchased twice in the same order, only one purchase is counted. |
| Average order value | Revenue divided by the number of purchases. |
| Revenue | Total revenue the block generates. |
Graphs
Each graph displays an indicator for the selected period.
Hover over the graph to see the indicator for each day of the selected period.
Sales rate
The sales rate reflects a product’s value by considering sales and price margin (if this option is enabled in your store settings).
Sales rate is a metric of product sales, which is estimated based on the number of sales and trade margin (if the parameter is enabled for a specific store). The minimum possible rating value is 1. This value is assigned to the product even if the sales rate is zero. This assignment is necessary, so the product can be ranked in the system. The maximum value is 300,000. When calculating the sales rate, each parameter is multiplied by a “weight” coefficient. The number of sales plays a key role, and, therefore, the parameter's weight is 1. The trade margin weight coefficient is 0.8.